Mapping Walking Areas in England and Wales
I love exploring areas with a lot of footpaths that lead away from roads. This map aims to find the local authority districts with the highest proportion of “walkable” routes compared to “drivable” routes:
The technique used to generate the map is described in my post on off-road cycling density.
What is counted as “walkable”? Basically anything that you can legally walk on, that isn’t the pavement or a road:
- Public Footpaths
- Bridleways
- Restricted Byways
- “Tracks” where foot access is explicitly allowed
- Byways Open to All Traffic (BOATs) [1]
What are the top districts for walking?
- High Peak - 2090
- Rossendale - 1948
- New Forest - 1930
- Ribble Valley - 1871
- Mole Valley - 1760
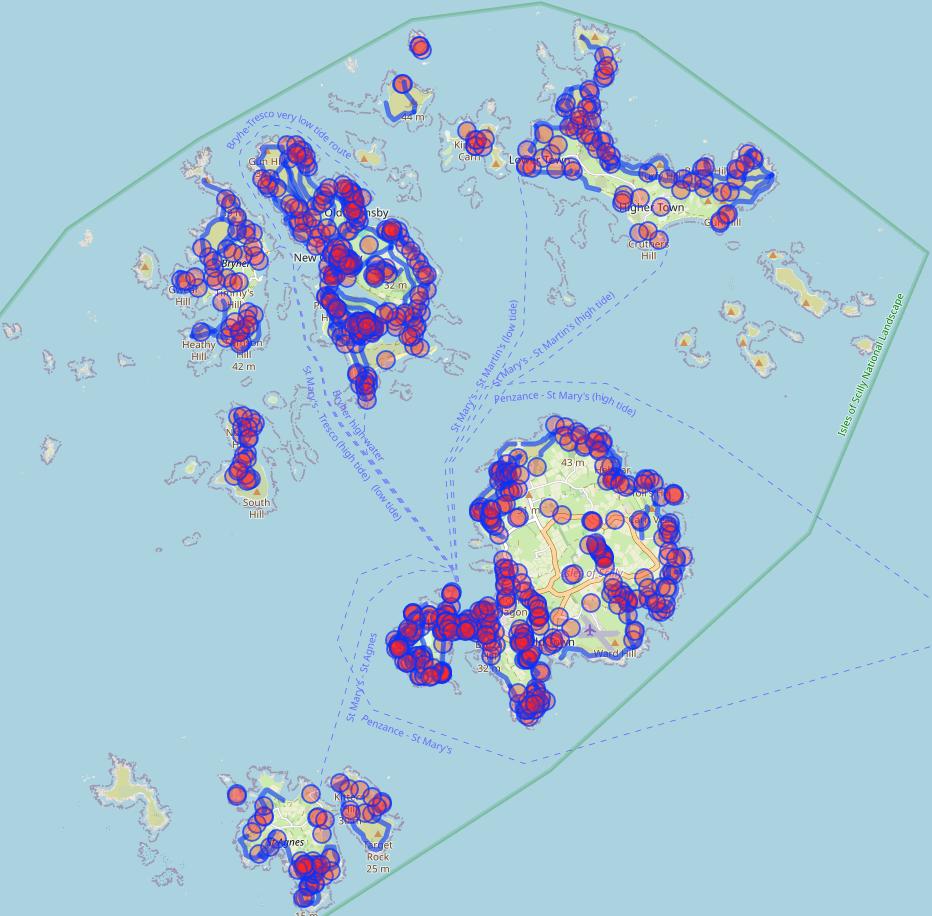
Note that Isles of Scilly has an anomalously high score of over 5000; the islands have lots of walking trails and very few roads. They are overall the best but they are such a small area and mess up the scale of the rest of the map, so have been omitted from the map.
And the bottom districts for walking?
- Slough - 252
- Wolverhampton - 277
- Knowsley - 287
- South Holland - 289
- Brent - 290
Now I really do need to get out and explore more of the UK!
[1] These are also open to vehicles, but in my experience are generally good walking routes.