Mapping Off-Road Cycling Areas with Overpass API
Which area of England & Wales has the densest network of off-road cycle routes? Until recently, I would have had no idea how to answer this question. But with Overpass API, Datawrapper, and an LLM, I found it surprisingly easy to whip up some results.
I enjoy cycling off-road and like to plot routes that avoid roads as much as possible. Will this help me find the ideal place to live?
Note that the map counts bridleways, cycleways, shared used paths, and more (see below). The choice to normalise by dividing by the length of the road network is justified below. You can see the data, as well as maps normalised by area and population here.
Map Takeaways
- Mole Valley and Chichester have the highest ratio of off-road cycle routes to roads
- Isle of Anglesey and Kensington & Chelsea have the lowest
- East London and Cambridge have the densest concentration of off-road cycle routes
- The map doesn’t reflect the quality of the routes in any way
- It’s hard to make a map that doesn’t correlate with another variable instead, like population density
Technology Takeaways
- Overpass API is a powerful tool for querying geographical data
- ChatGPT is impressively good at writing queries for it
- Datawrapper produces beautiful chloropeth maps with minimal effort
- OpenStreetMaps tagging has a lot of inconsistencies
Analysis
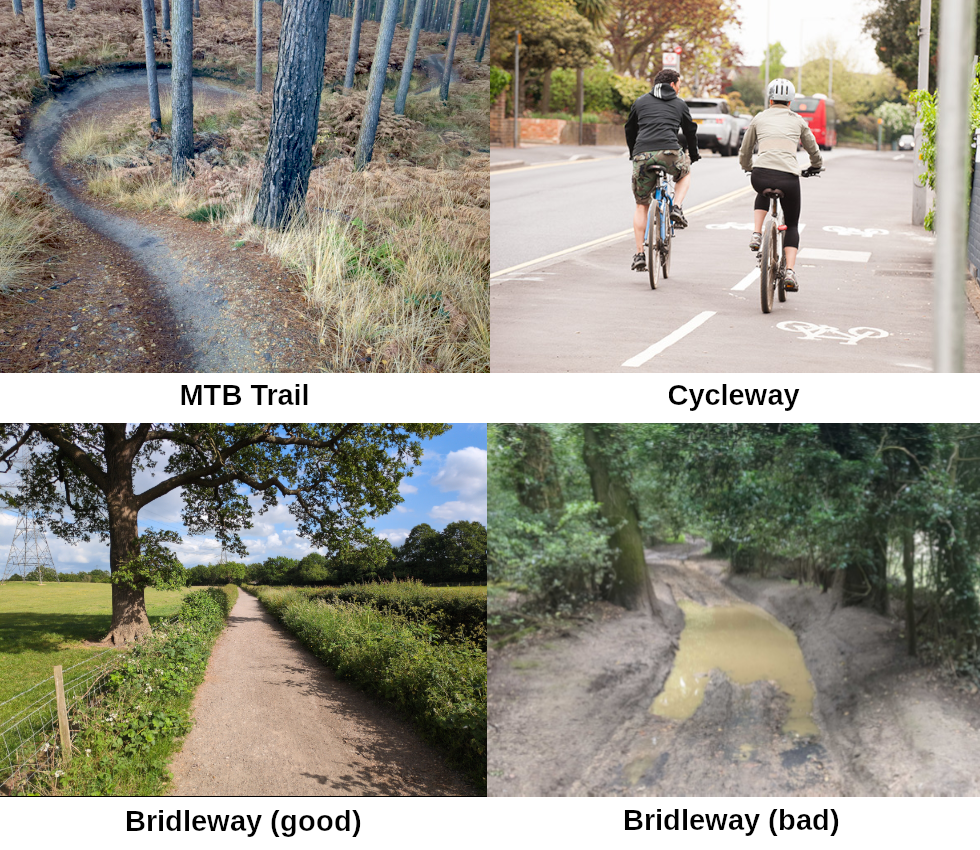
This was a fun exercise but there’s definitely a lot of caveats to the data. Firstly, there is little comparison between a mountain bike trail, a picturesque bridleway, and an urban cycleway. Although all are off-road cycle routes, each serves a completely different purpose.
Further, even if we limit our search to just one type of cyclable route, the quality of them varies hugely - even within the same area. Some bridleways are excellent, others are virtually unrideable. And I would prefer to cycle on a quiet road rather than a busy, interrupted, debris-strewn shared use path.
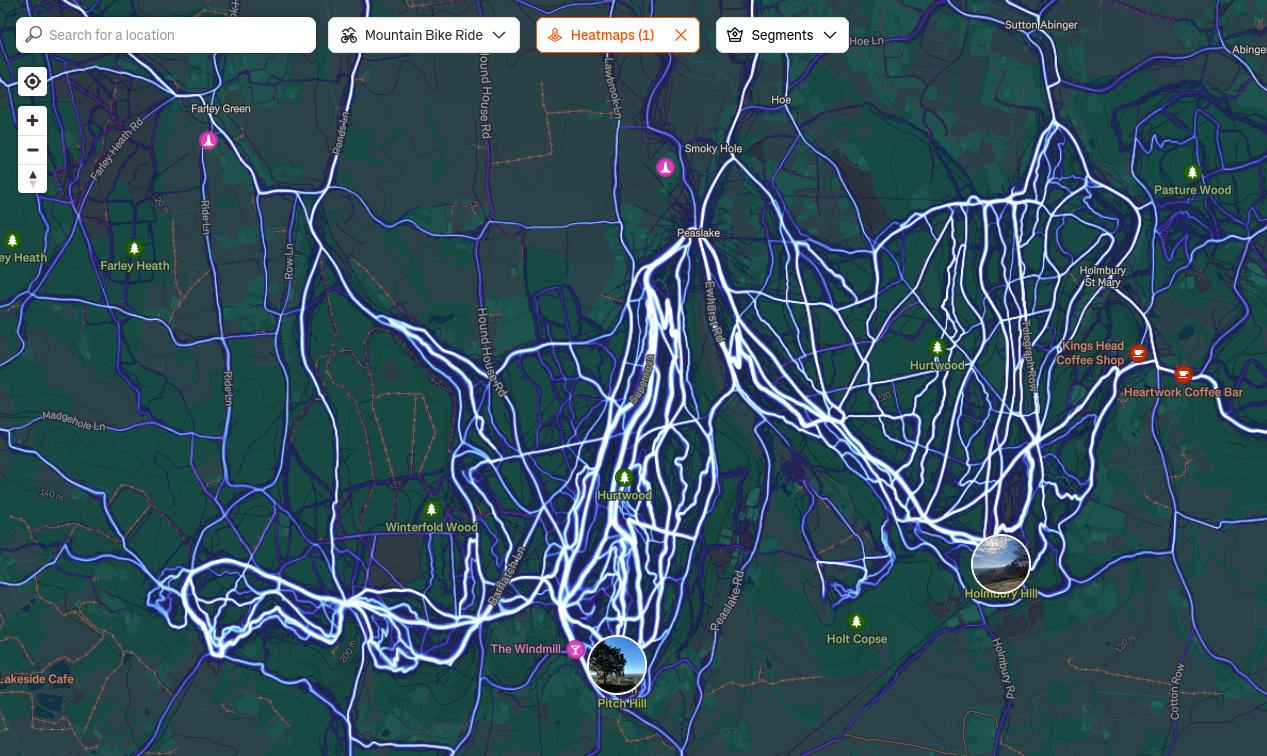
The Strava or Garmin heatmaps are the most valuable data in my opinion, as they show where people actually ride:
What about the rest of the UK?
Since 2003 Scotland has been way ahead of England, with broad access rights for non-motorised vehicles over the countryside. Looking at the official routes in Scotland doesn’t capture the far greater density of legally accessible land for cycling. Disappointingly, although England and Wales implemented a limited right-to-roam over moorland in 2000, this applied to walking only.
I didn’t look at Northern Ireland because it uses different administrative boundaries and it was easier to focus on England and Wales for the initial analysis. A look at bridleways.uk shows it has very few bridleways.
Process
The rest of the blog documents how I produced the map. Here’s a link to the data.
Bridleways
The closest previous work was a site called bridleways.uk. Bridleways are horse-riding routes which cyclists have also been allowed to ride on since 1968. My initial idea was to grab the per-county bridleway length calculations from that site, but the numbers appeared to be far too low, and I wanted to go to the source of the data. This would allow me to include all off-road cycle routes, and show the availability of those routes in smaller areas across the country.
Bridleways.uk gets some of its data from rowmaps and the rest from OpenStreetMap, a community-driven map database that is particularly good for outdoor mapping like hiking trails and cycling routes. OpenStreetMap data is used by platforms like Strava and Komoot.
Overpass Turbo
I found Overpass Turbo, a resource for freely querying OpenStreetMap data. Overpass has a tricky query language which ChatGPT was awesome at assisting with.
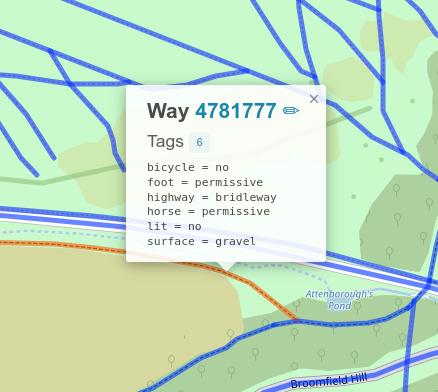
OpenStreetMap uses the term “highway” as a catch-all for roads, paths, and tracks. Highways are tagged with information about their designation and who is permitted to use them. By navigating to a part of the map you know well and running the following query, you can view the tags on all the highways:
Inconsistent Data
Exploring the OpenStreetMap tagged data, I discovered it was often inconsistent and confusing in terms of how it indicated cycle access. Partly I think this is due to it being a community map with different users adding different tags to represent the same information. It’s also probably to do with how complicated the access situation is in England (and the rest of the UK, besides Scotland). The following are places where you can usually ride your bike:
- bridleways
- restricted byways
- BOATS (byways open to all traffic)
- shared used paths
- permissive paths
- cycle tracks
- canal towpaths
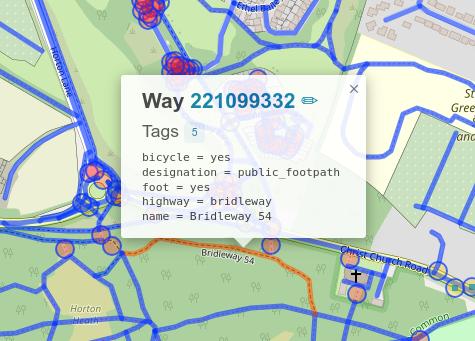
The following is marked as a bridleway but (presumably incorrectly) with a designation of public_footpath:
Meanwhile the following is a bridleway, but a local bylaw prohibits cycling, and the tags correctly show this:
The following is a track, a kind of miscellaneous highway, which is on private land, but with permissive bicycle access:
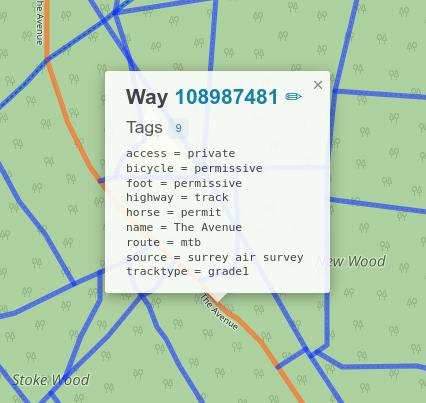
That’s one of the best cycle routes in the area, and if you are just looking at bridleways or cycle paths, you’ll miss it. So writing a query to capture all these highways is not immediately straightforward.
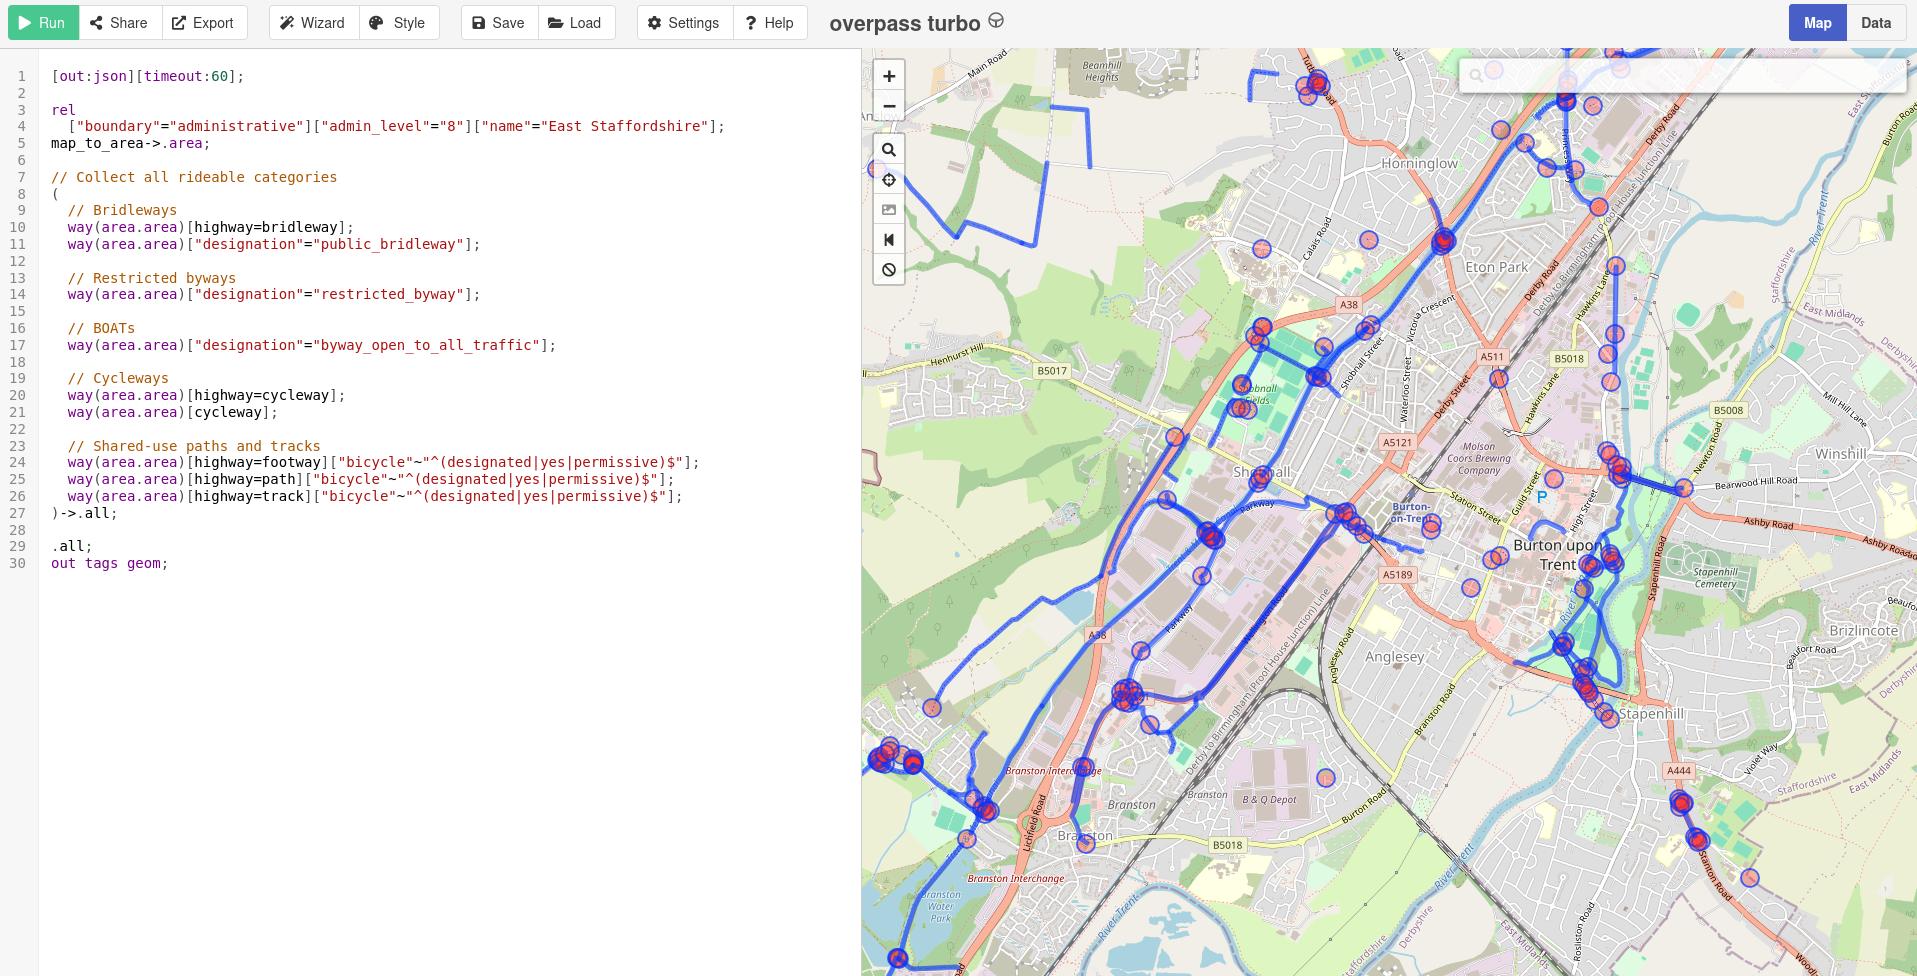
Length Query
Bearing that in mind, I enumerated all the ways that off-road cycle routes are represented and summed the length of them in a given area. The resulting Overpass query is not perfect but provides a close enough approximation.
I tested on the county of Surrey, and the query returned 11190 cyclable ways with a total length of 2070 kilometres.
Ceremonial Counties Density
ChatGPT helped me with a small script to run this query for each of the 48 ceremonial counties in England. I fetched a list of counties together with their areas from here.
I had some trouble with the OpenStreetMap data, since Hertfordshire, Norfolk, Suffolk, Worcestershire, Warwickshire, Shropshire, Northumberland, Greater Manchester, and the City of London were not marked as ceremonial counties, so those areas had to be selected using an administrative boundaries tag.
I also got a surprisingly low density result for Tyne and Wear. It turns out that the area figure reported on the website above was missing a zero, and after correcting that Tyne and Wear is one of the top counties.
I then plotted the results using Datawrapper:
Cool! Datawrapper helps you make really nice visualisations with relatively little effort. However…
Density Limitation
An obvious issue with the Cyclable Density metric is the strong correlation it has with population density (r/peopleliveincities). Urban areas are more likely to have cycle infrastructure, therefore the map ends up resembling a population density map:
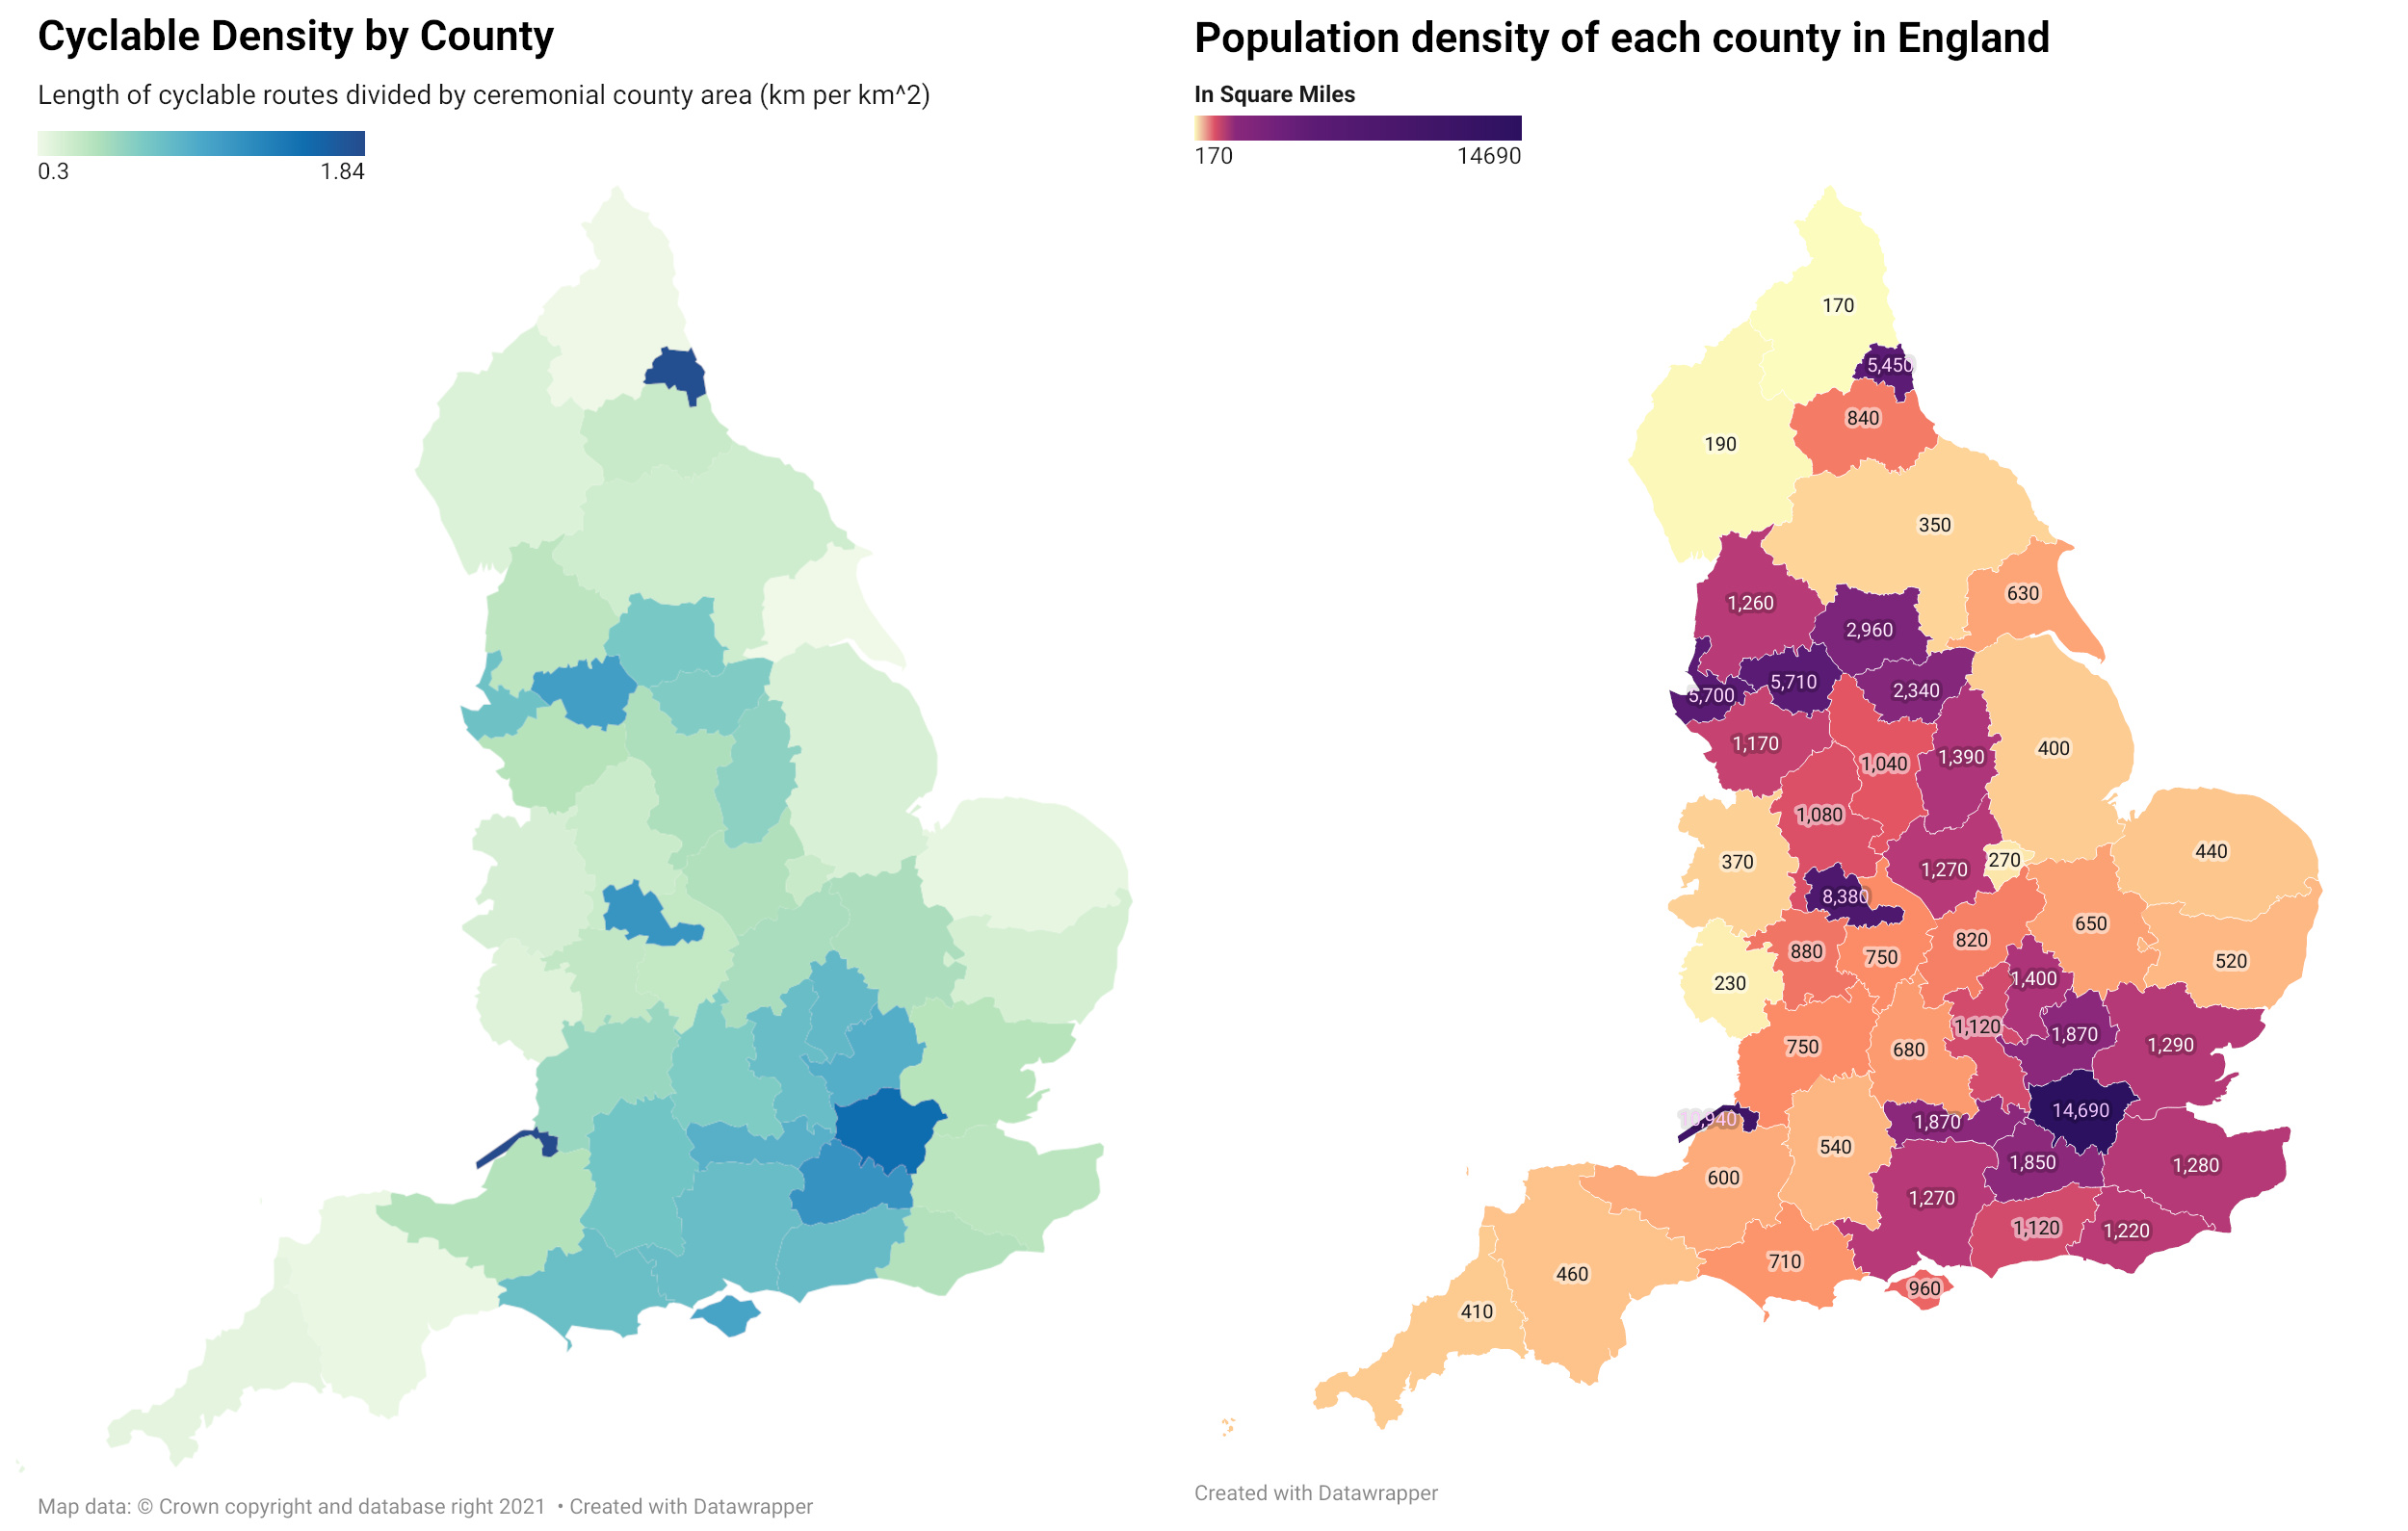
Nevertheless, there’s still some observations that can be drawn. For instance, Essex, Kent, and East Sussex are clearly behind the rest of the Home Counties for off-road cycle routes. Wiltshire and Dorset on the other hand are doing pretty well.
Per capita
Attempting to compensate for the urban density effect, I divided the cyclable length by population instead, to get the per-capita provision of off-road cycle routes:
This completely changes the map, with urban areas now having the lowest scores. This map highlights that Cumbria is the place to go if you want cycle routes all to yourself.
Local Authority Districts
The county area data is not really granular enough, so I went a level deeper by mapping local authority districts. There are 296 local authority districts in England.
Learning my lesson from before on inconsistent OpenStreetMaps tagging, I found what appeared to be a definitive way to query districts using GSS codes. I pulled a list of the districts mapped to GSS codes from here and joined that up with areas from Wikipedia.
Once again however I had to special-case some districts with an administrative boundaries tag selector. OpenStreetMaps does not seem to have up-to-date GSS codes tags for East Staffordshire, Lichfield, Stafford, Staffordshire Moorlands, Tamworth, North Warwickshire, Nuneaton and Bedworth, Rugby, and Warwick.
Link to script used to produce the map below:
Aggregation Bias
After sharing the density map on social media, I got some great feedback. On the whole the results seemed to match people’s intuition, but there was confusion why areas like Gloucester or Tyneside scored highly while areas like the Peak District did not.
This seemed to relate to the enormous variation in areas of the districts - from North Yorkshire at 8037km2 to City of London at 3km2. Adding to the urban area skew, the larger areas may contain great off-road cycling areas that are diluted by large empty areas of farmland.
In other words, smaller, more densely populated districts get higher scores than they seem to deserve. However, mapping per capita instead goes too far in the other direction, unduly penalising areas with high population density.
The general term for this seems to be “aggregation bias”. Although Wikipedia has a more in-depth article on the Modifiable Areal Unit Problem (MAUP): referring to statistical distortions that appear when spatial data are aggregated into areas that differ greatly in size or shape.
Normalising by road network length
A few people suggested a compromise which is to look at kilometres of off-road cycling routes per kilometre of road. In other words, the length of all off-road cycling routes as a percentage of the length of the road network. This somewhat controls for the level of urbanisation in a district. I also added data for Wales.
That’s how the map at the top of the article was produced.
This changes the results in a direction which makes sense. Mole Valley and Chichester are top, the only two districts with off-road cycling routes over half as long as their total road networks. These areas have immense bridleway networks in the North Downs+Surrey Hills, and South Downs respectively.
Meanwhile the Isle of Anglesey, and Kensington and Chelsea were the lowest with around 25x as many roads as off-road cycling routes.
Future Work
It shouldn’t be too difficult to adapt the scripts here to produce maps for footpaths and other amenities.
I would like to break the data down further to be more granular than just local authority districts - the next lowest administrative division in England is civil parishes.